

3 Steps to Understanding and Unlocking Your Product’s International Growth Loops

Phil Carter is the Senior Director of Growth at Quizlet, an EdTech unicorn that serves students and teachers around the globe. He was previously a founder, venture capital investor, and Director of Product at Ibotta.
Imagine you are a product leader at a fast-growing US startup that has strong product/market fit and is beginning to turn its attention abroad. You’ve already begun to localize your product in other languages, and you’re starting to see organic adoption pick up in international markets. However, you haven’t been able to reach a tipping point in any one country, international user engagement and retention rates aren’t as healthy as the US, and you’re starting to see your aggregate international growth show signs of decelerating. Sound familiar?
Many US companies believe one model for comparing US vs. international growth is sufficient, but most products grow very differently across international markets. This is because differences in language, culture, consumer preferences, willingness to pay, and competition can dramatically alter the behavior and performance of a company's core growth loops.
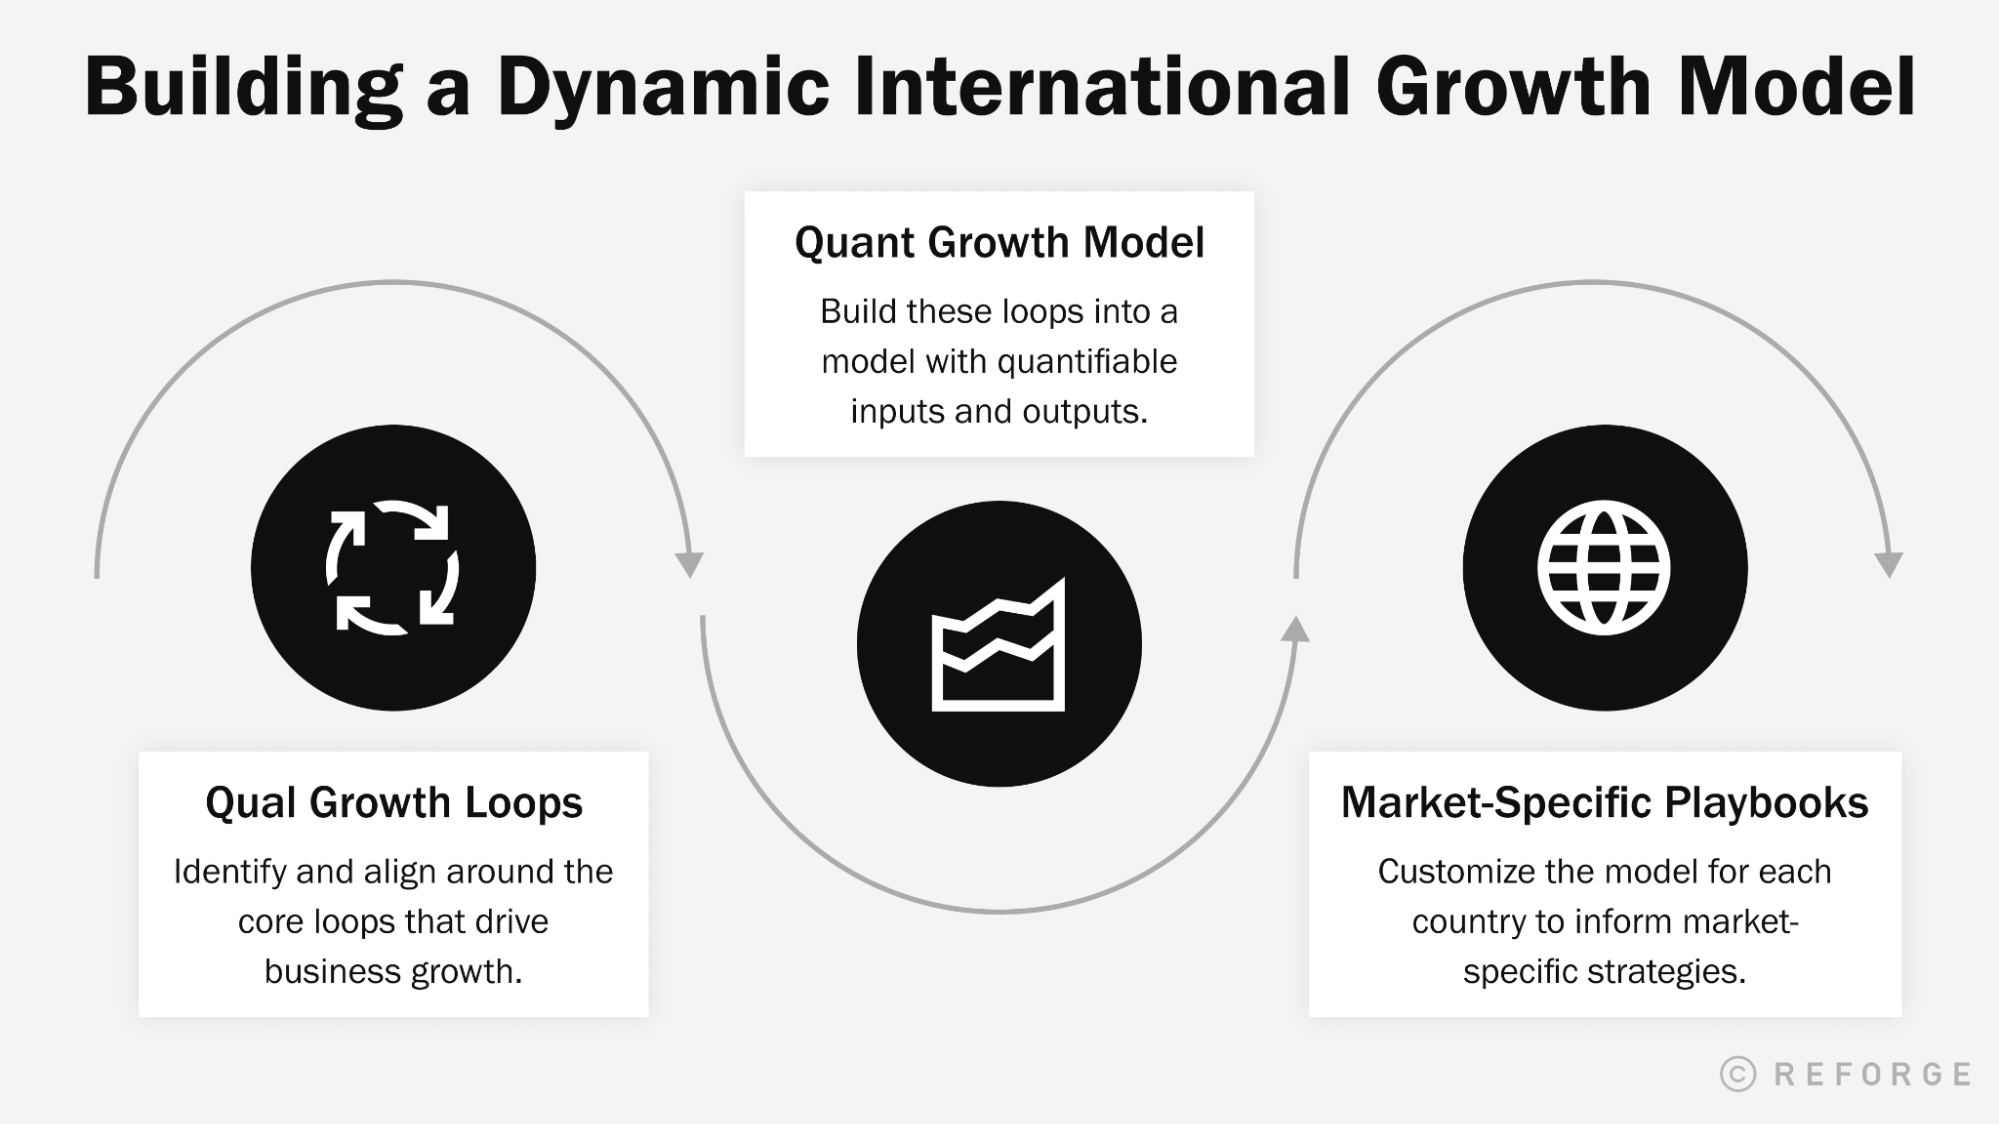
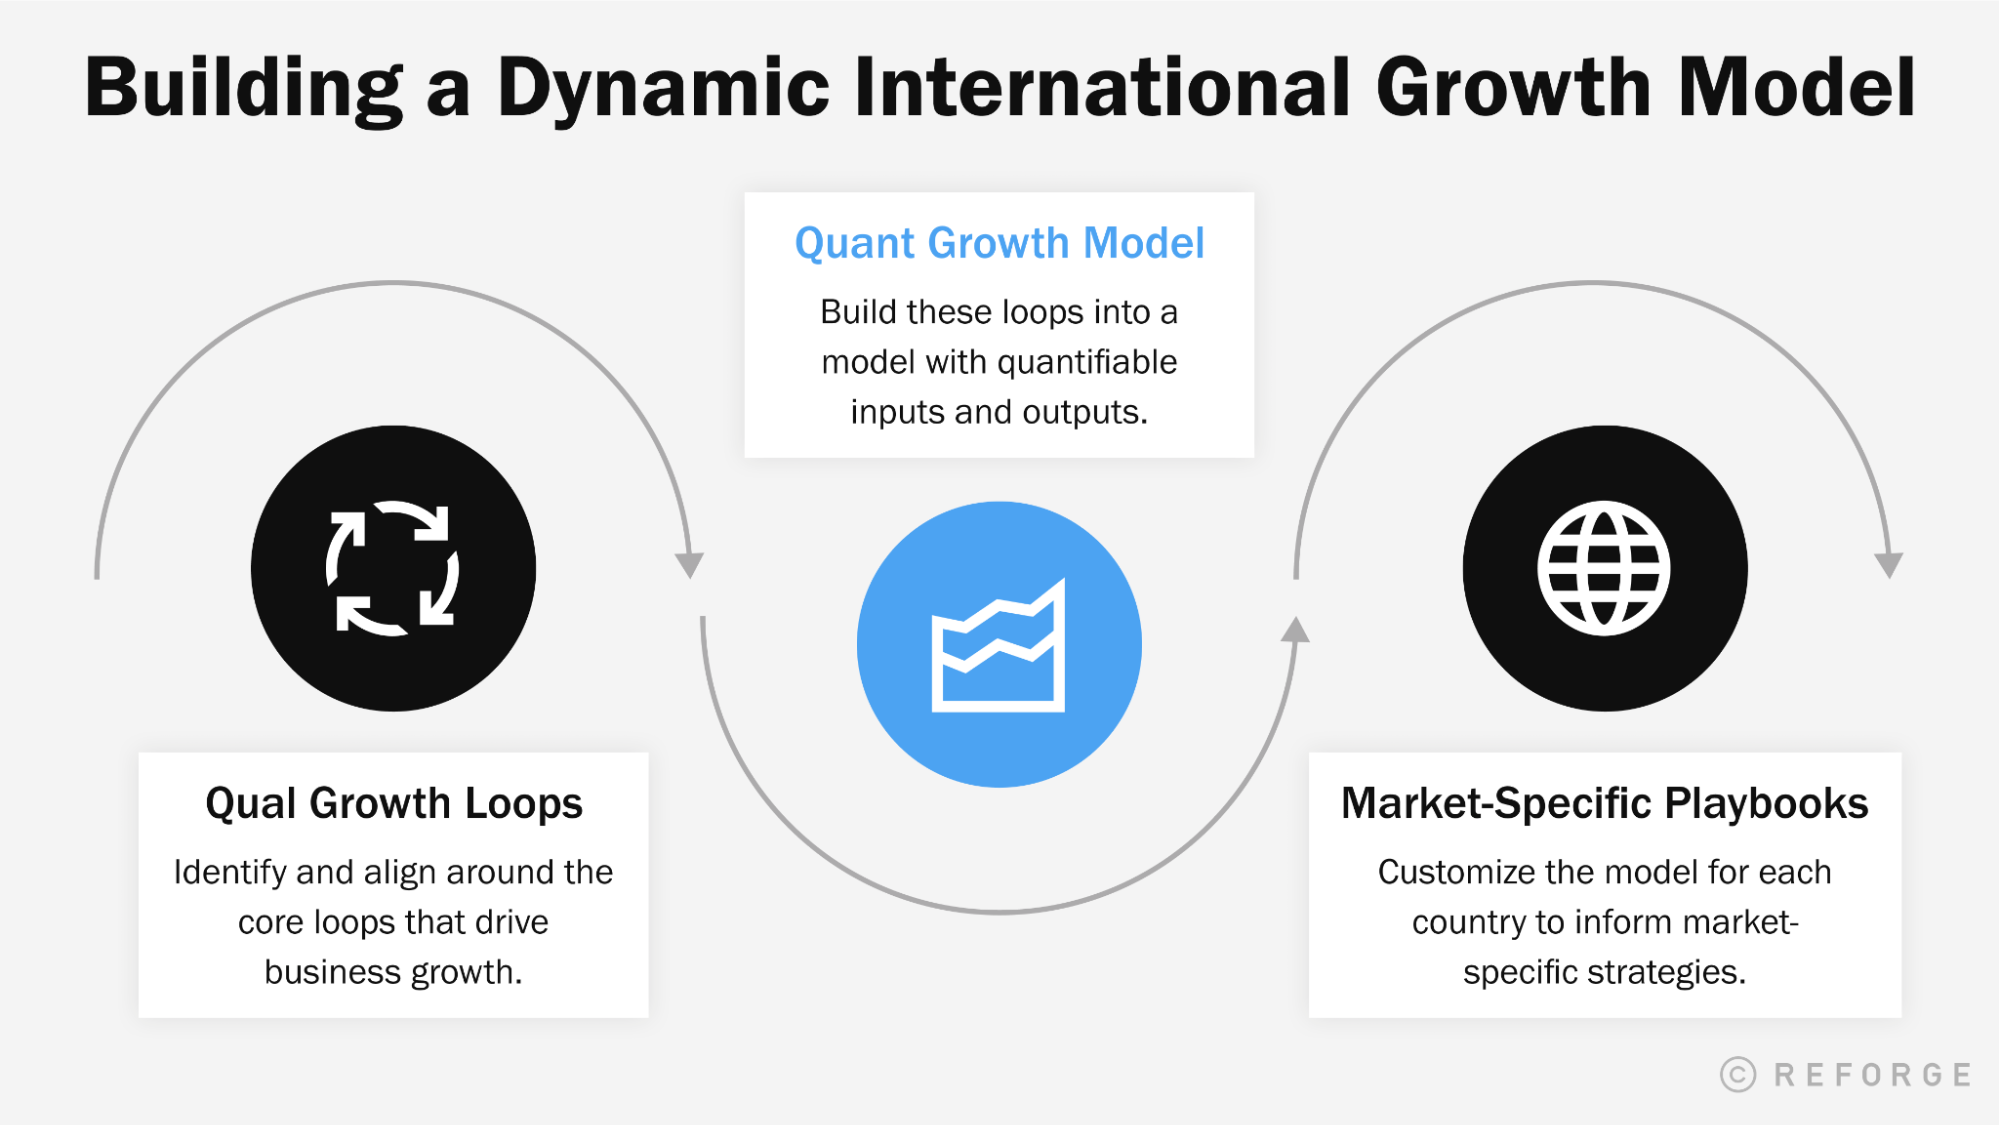
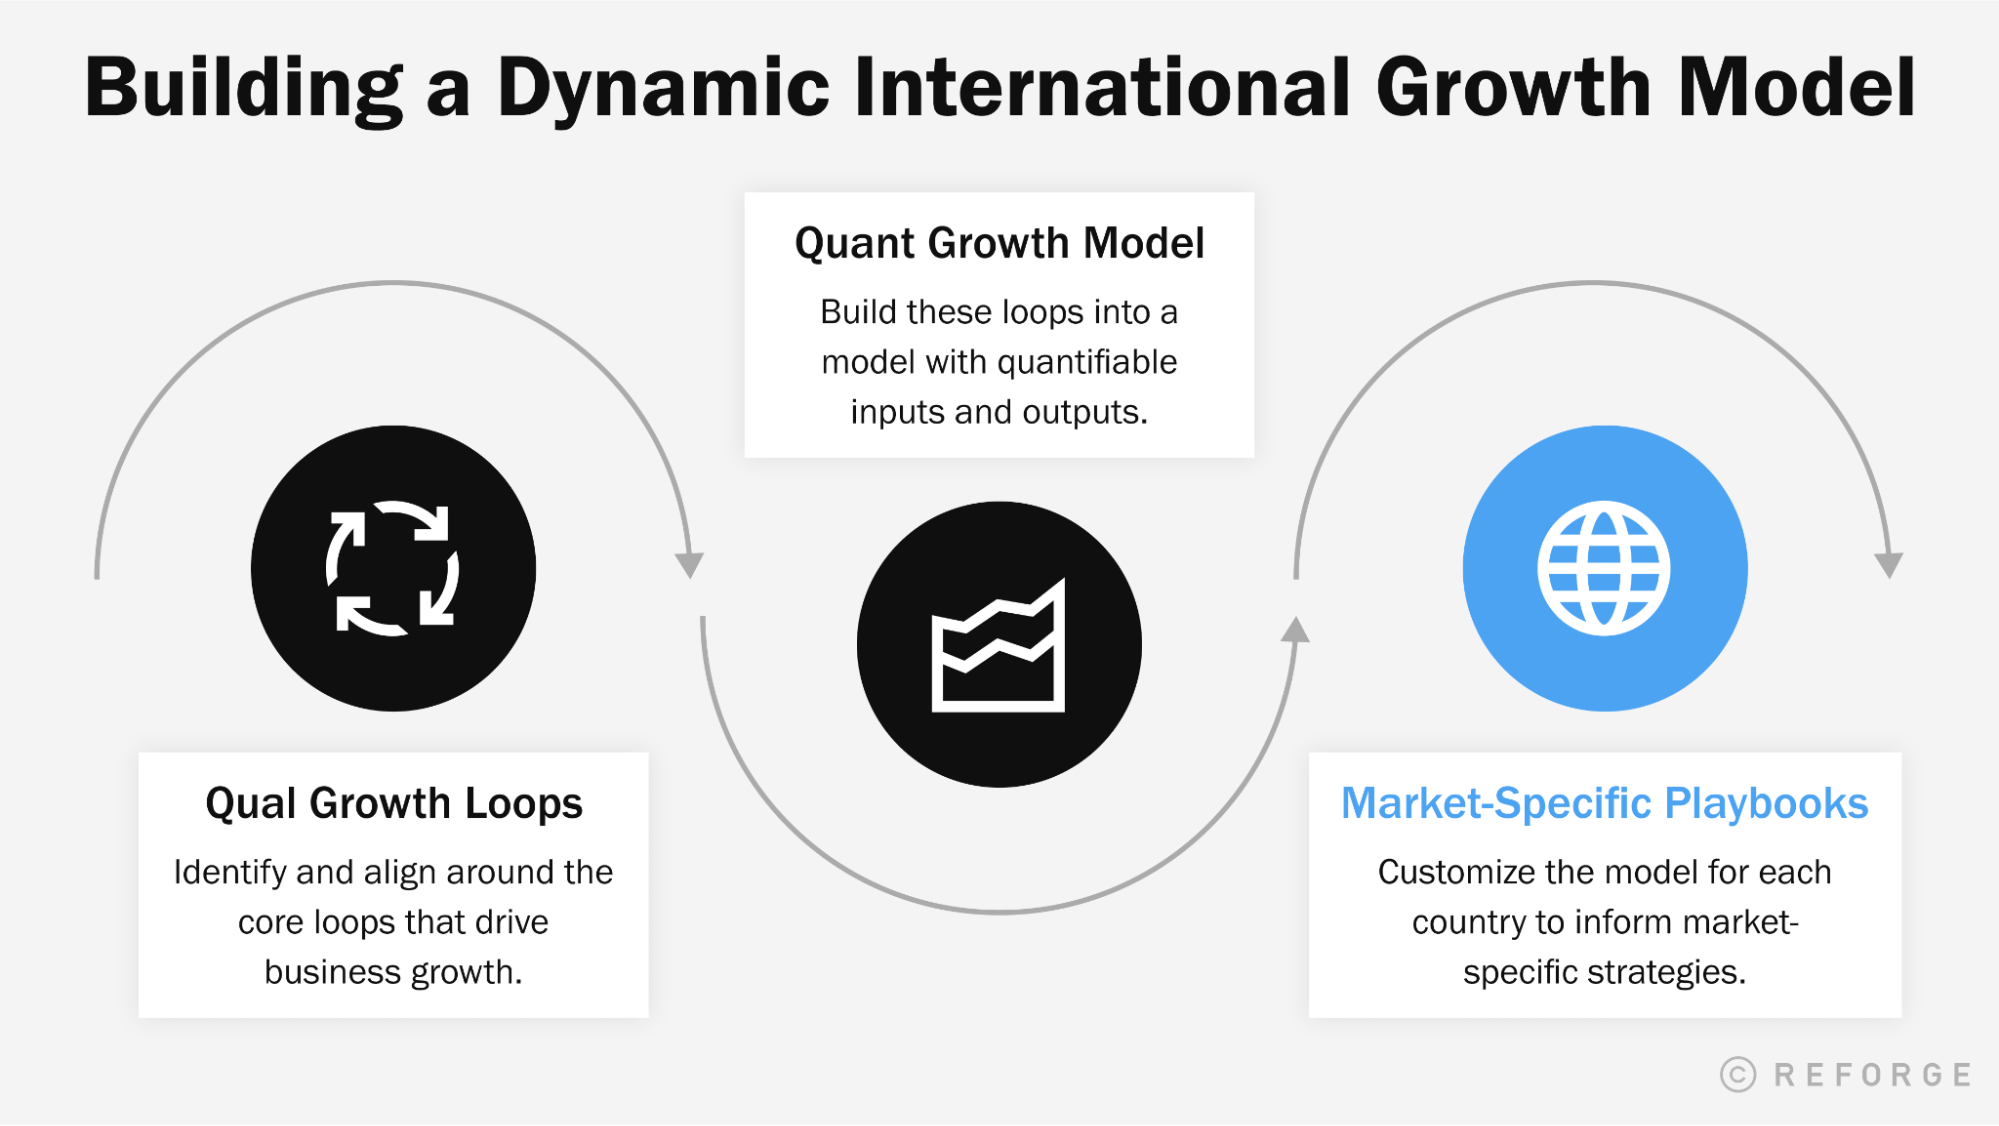
By building a dynamic international growth model that analyzes how a product grows in each country and identifies important constraints, companies can build market-specific playbooks to unlock local growth. This involves three steps:
Mapping your growth loops: Everyone at the company should align around and deeply understand a qualitative mapping of the core loops that drive growth for the business.
Building a quantitative growth model: This qualitative map can then be converted into a quantitative model that measures the key variables needed to drive core growth loops.
Developing market-specific playbooks: By replicating the quantitative model across countries and comparing the performance of key variables, companies can understand which core growth loops are most important in each market, identify the constraints on these loops, and employ tactics to remove these constraints and accelerate expansion.
Note that a model like this depends on having a critical mass of international users who can be analyzed and compared across countries, so for companies that have not yet achieved minimum scope in at least a couple markets, this framework will be less valuable.
However, if you work at a company that has some international traction but hasn’t established repeatable and scalable growth, understanding how your growth loops vary across countries and building market-specific playbooks can help satisfy The Pillars of International Growth that I outlined in a previous post.

These include establishing strong product/culture fit, ensuring customer accessibility, and investing in one or more universal currencies to help your company grow across international borders. Collectively, these pillars provide the basis for any successful international growth strategy, and this blog post will go deeper on how to establish them.

Mapping Your Qualitative Growth Loops
While international success typically requires different tactics than those that worked at home, it helps to start with what your company already knows and expand from there. With that in mind, the first step a company should take to understand how it can drive international growth is outlining a qualitative map of the core loops responsible for driving its domestic growth.
Valerie Wagoner, Stripe’s Head of Product for APAC who has previous experience as a founder, executive, and Reforge EIR, emphasized how important it is for a company’s CEO and executives to align around a shared understanding of how the company grows in recounting her experience as a Senior Director of Growth at Twitter after they acquired her company ZipDial:
“A deep understanding of the company’s growth model is essential. I joined Twitter at a point where growth had been flat for about a year, and there was no clear opinion on why because no one had clearly captured and articulated how the company was growing in the first place. Obviously there was Twitter’s core User Generated Content (UGC) loop, but at some point, this loop began to slow down and nobody understood why. Until I was able to diagnose root causes, improve its core loop, and supplement it with other loops, Twitter saw MAU growth stagnate.”
When I joined Quizlet in late 2018, the company had just reached 50 million MAUs thanks to several years of rapid growth in the US as well as accelerating growth in international markets. However, while the company knew its growth was fundamentally driven by a combination of word of mouth between teachers and students as well as organic search traffic powered by user-generated study content, we didn’t yet have a deep understanding for the mechanisms responsible for driving these core growth loops or how to control them.
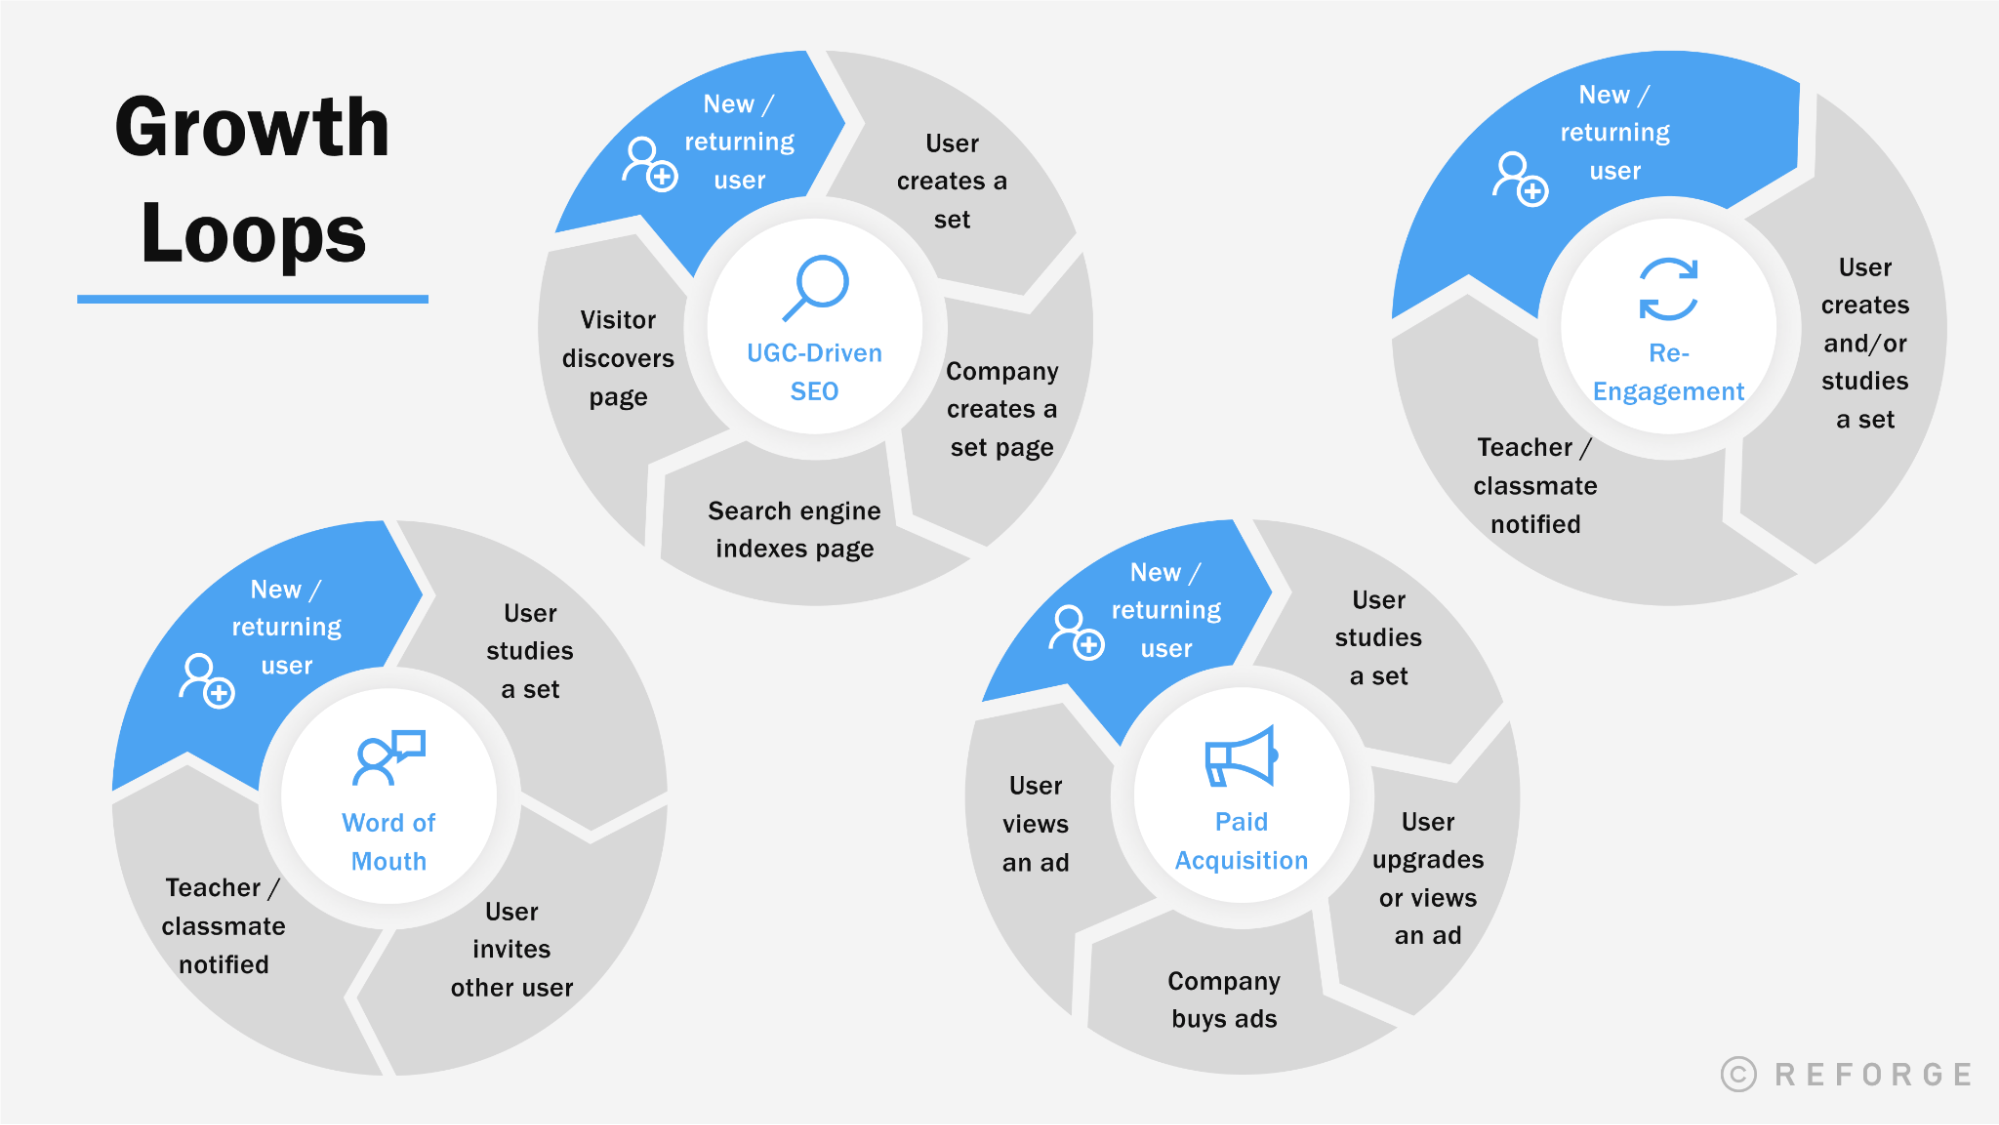
In 2019, Quizlet’s core growth loops were Word of Mouth, UGC-Driven SEO, Paid Acquisition, and various Re-engagement loops.

One of the first things we did on the growth team after I joined was outline a qualitative mapping of Quizlet’s core growth loops and socialize it across the company to get everyone aligned around a shared understanding of how our business grows. Through this process, we learned that at that time, there were six key actions driving Quizlet’s growth:
Studying content
Creating content
Inviting friends
Viewing an ad
Upgrading to a paid subscription
Purchasing premium content
These six actions powered four core growth loops:
Word of Mouth
UGC-Driven SEO
Paid Acquisition
Re-Engagement
Building a Quantitative Growth Model
Once your company is aligned around a qualitative understanding of how the business grows, a quantitative growth model can be built to measure the key variables — such as referral, content creation, and subscriber conversion rates — responsible for driving each core growth loop.
At Quizlet, we broke this process down into four steps:
We built a basic MVP of the growth model. This initial version of the model was limited to US web users, but it allowed us to incorporate all the key variables and core growth loops that we needed to adequately model Quizlet’s business.
We validated this MVP model against our financial model. By comparing the most important outputs of our model vs. the financial model that our executive team used to run the business and report to the board, we confirmed that our model was accurate.
We expanded the MVP into a full growth model. Once we had validated the MVP and secured buy-in, we built a more comprehensive version of the model with all the variables that powered our four core growth loops across user types and platforms.
We used SQL and Python to automate the growth model. Finally, we linked the full version of the growth model to our underlying SQL database and wrote a Python script that allowed the shell of the model to be easily reproduced, so that the model would automatically update itself each month and could also be replicated across countries.
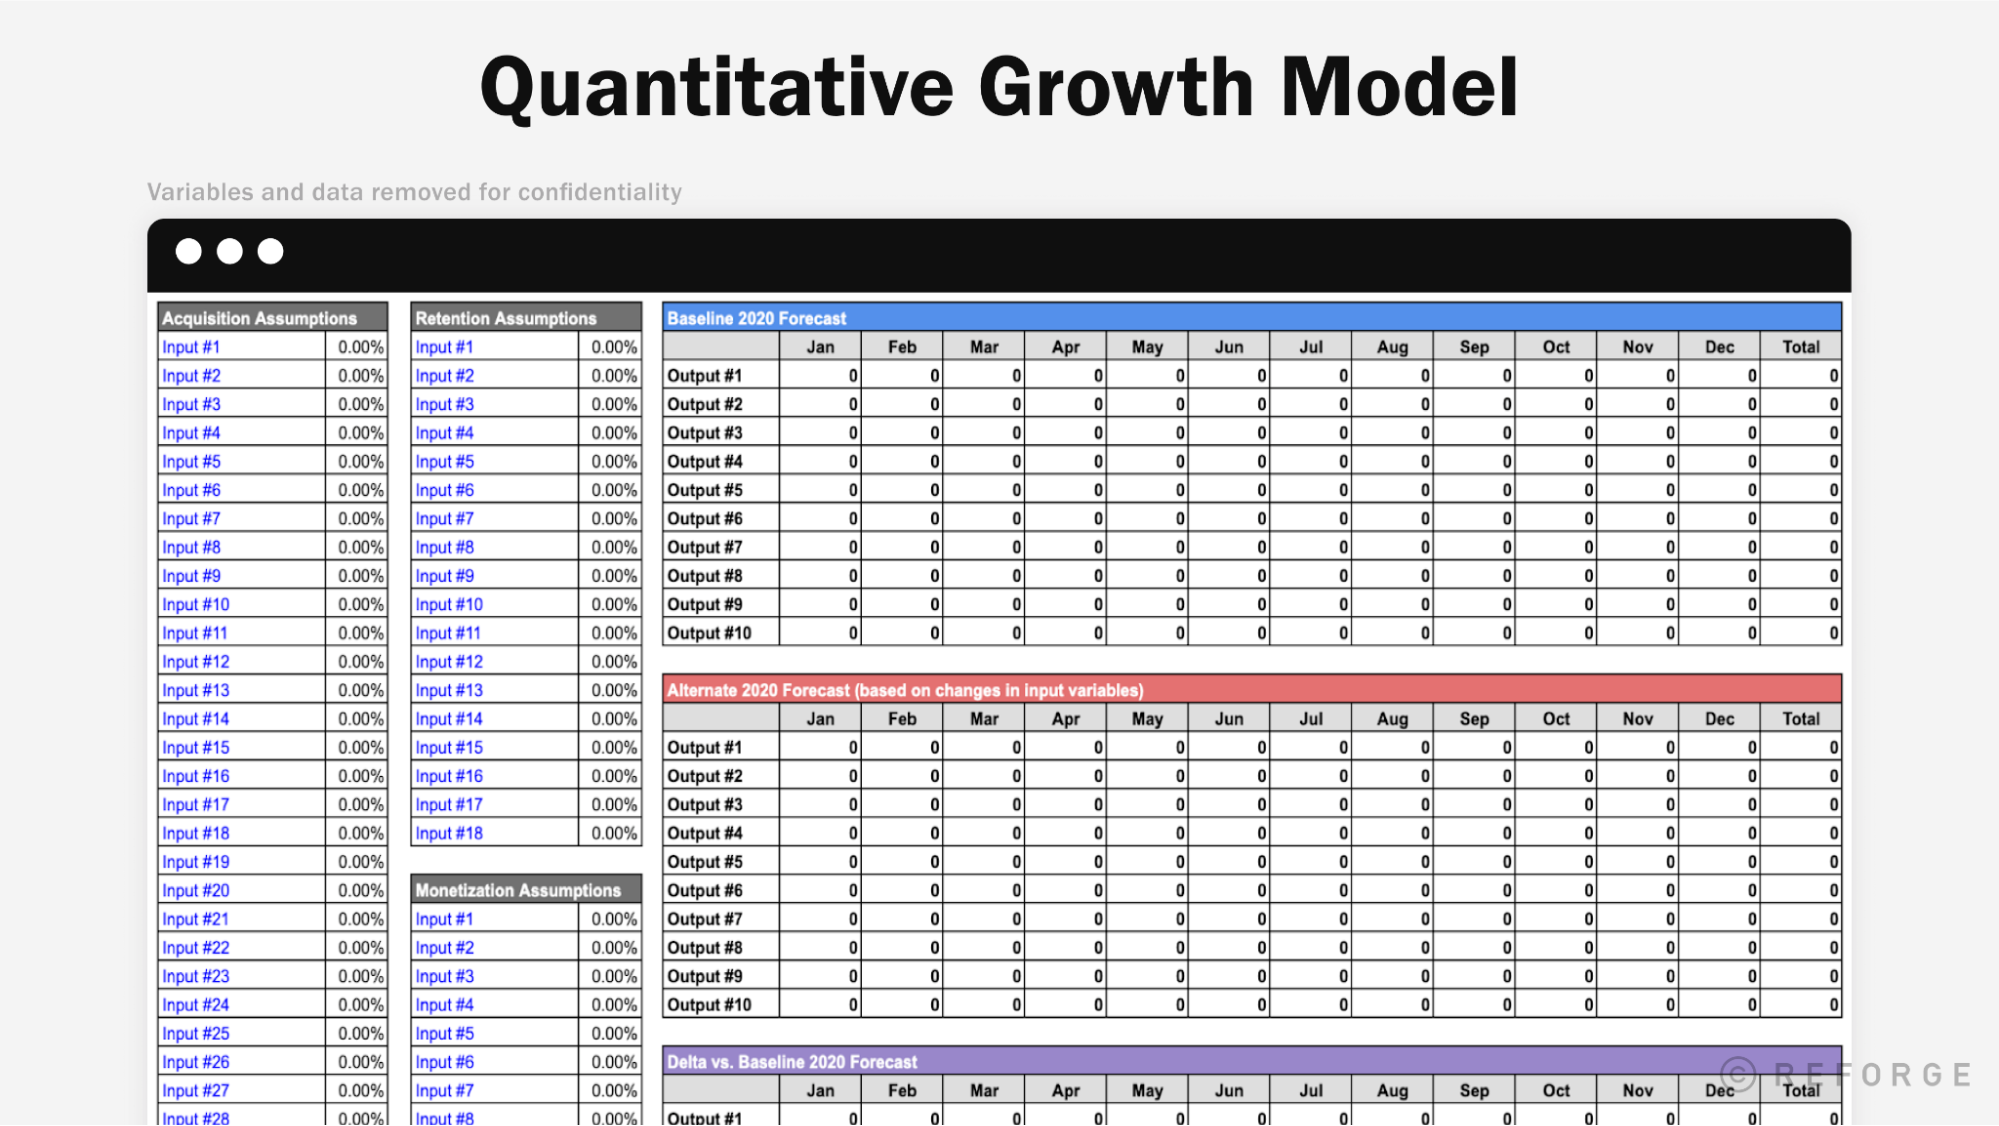
A representative snapshot of Quizlet’s growth model in 2019. The input and output variables and data have been removed from this figure to preserve confidentiality.
After completing these four steps, we had a quantitative growth model consisting of ~100 input variables and ~20 key outputs that not only provided an accurate summary of Quizlet’s historical growth trends, but could also offer a directionally accurate forecast of future growth based on estimated changes to each of the input variables.
This provided us with a powerful tool that could be used for multiple purposes, including:
Comparing growth across user types and international markets
Analyzing model performance to identify new strategic opportunities
Setting OKRs and A/B test targets to support growth team experiments
Also, because the model was built on our SQL database using an easy-to-update Python script, it could be dynamically updated at any time and adapted for different types of analysis.
For members interested in learning more, Reforge’s Advanced Growth Strategy course offers lessons on how to build a qualitative growth map and how to build a quantitative growth model, along with examples for prominent companies like Slack, Pinterest, and Grubhub.
Developing Market-Specific Playbooks
Once your quantitative growth model is built on the right flexible architecture, it can be replicated across countries to support market-specific strategies and playbooks. This is critical because the growth tactics that work in one country often don’t work in other countries.
Crystal Widjaja, CPO at Kumu and former SVP of Growth at Gojek, experienced this challenge:
“A couple big mistakes we made at Gojek during the early days of international expansion were failing to understand the core growth model that made the company successful in the first place and overestimating our ability to transfer tactics that worked in one market to another market.”
Gojek initially grew in Indonesia through a casual contact loop fueled by branded jackets that its motorcycle taxi drivers wore on the job as they drove around the city. But when Gojek expanded into new markets where wearing uniforms did not fit the local culture, or where transportation was primarily supported by cars instead of motorcycles, this growth loop needed to be adapted. In Singapore, it meant wrapping cars with the brand’s logo, which changed the dynamics of the loop because car wraps were more expensive than uniforms and felt more intrusive to drivers.
At Quizlet, we developed a Python script that allowed us to cut and analyze the key metrics in our growth model for individual markets using country codes. The process of replicating the model for a new country or region and validating its accuracy took half an hour, making it possible for us to spin up and analyze models for each of our most important target markets.
This lets us compare input variables across countries and regions and analyze how differences in the performance of these variables impacted overall user and revenue growth in each market.
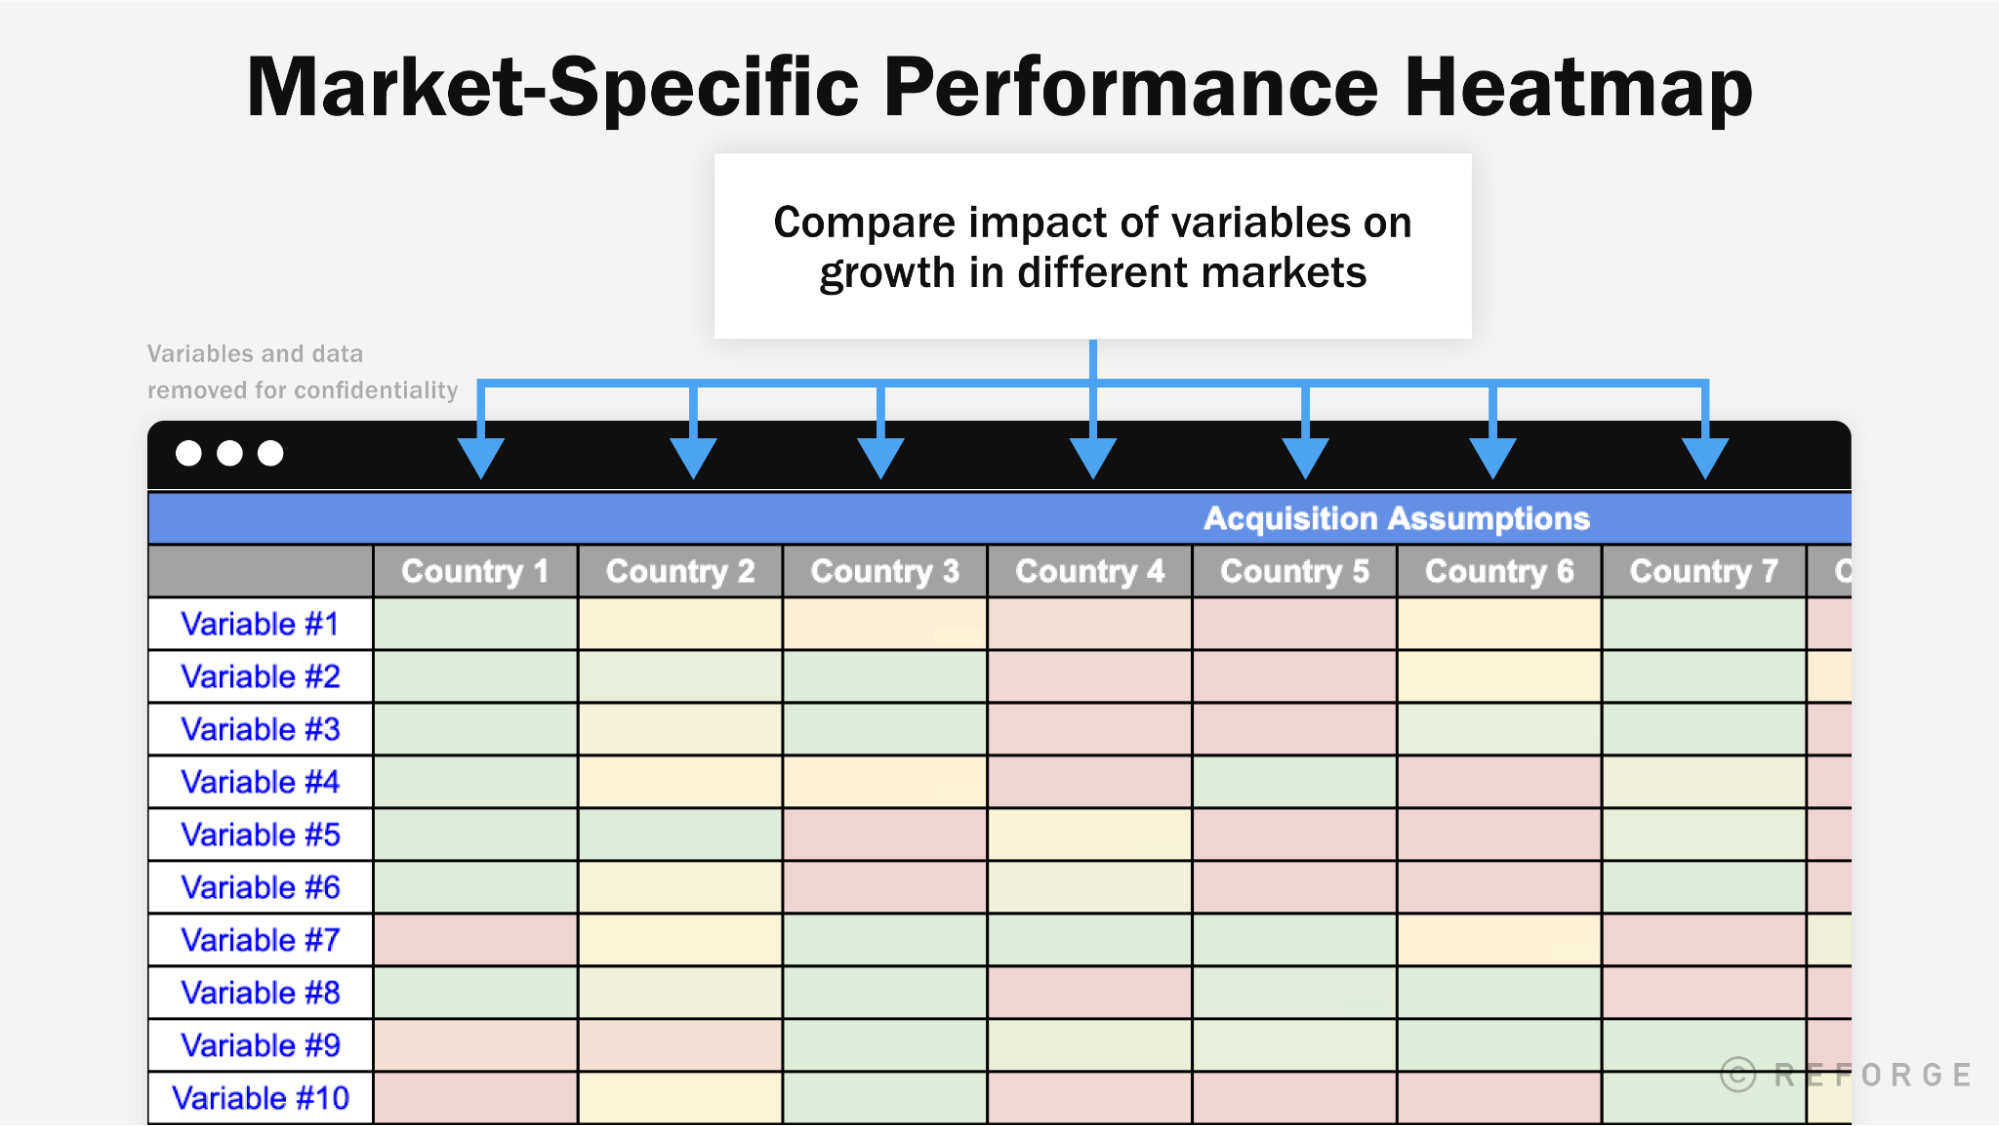
After replicating our growth model across countries, we built heat maps comparing performance of key variables to highlight countries that performed particularly well or poorly for each variable. The data has been removed from this figure to preserve confidentiality.
This analysis resulted in several critical insights that helped Quizlet begin to develop market-specific growth strategies and playbooks based on:
Which core growth loops were strongest in each market: While Quizlet’s four core growth loops existed in some capacity across all international markets, we found that certain loops performed more strongly in certain countries vs. others. For example, some countries grew primarily through UGC-Driven SEO, whereas other countries relied more on Word of Mouth to power user growth. We also observed patterns in which types of countries tended to be more SEO vs. Word of Mouth driven that led us to more insights.
How core growth loops operated differently across markets: We discovered that the underlying dynamics powering core growth loops differed across markets. For example, in some countries teachers drove the majority of sharing and referrals fueling our Word of Mouth loop, whereas in other countries, students drove more of this activity.
Where core growth loops were constrained: Finally, we could take any growth loop, break it down into parts, and identify where the loop was constrained in each country. For example, we deconstructed our UGC-Driven SEO loop into variables for the percentage of users who became content creators, the amount of content created by each creator, the percentage of content indexed and ranked by search engines, the amount of traffic generated by ranked content, and the performance of this traffic. This analysis showed us that in some countries we had a content creation problem and needed to encourage more users to create more content, whereas in other countries we had a technical SEO problem we needed to fix to get more existing content ranked.
Armed with these insights, Quizlet has begun to break our broader international strategy into more actionable, market-specific playbooks focused on removing constraints from the most important core growth loops in each country. We also identified archetypes of markets that tended to grow similarly, which allowed us to identify common tactics that were more likely to work for any country within a given archetype. While these playbooks still require a lot of iteration and refinement, the insights we developed through this analysis provided the company with a headstart in figuring out how to adapt its growth model in each market to satisfy the three Pillars of International Growth outlined in my previous post, helping us to find product/culture fit, ensure customer accessibility, and identify universal currencies to support international growth.
Valerie Wagoner recounts doing similar work in one of her previous roles:
“A lot of what I did at Twitter was to define what our growth model looks like, understand how we are constrained overall and in each international market, and then develop strategies to remove growth constraints in each individual market. As you might expect, these strategies turned out to look very different in countries like Japan vs. India vs. the UK.”
Executing Your International Growth Strategy
So now that you understand your company’s growth model and how its core growth loops differ across international markets, what can you do with this knowledge?
While this is a good start, it doesn’t mean anything without execution. The next step is building an international growth team. While there is no perfect blueprint and companies have found many models that work, there are a few things every company must get right to set international efforts up for success. These include securing top down buy-in from the CEO, aligning executives around an international growth strategy, and establishing an organizational structure that puts the right people in the right roles to solve the most important problems for satisfying the Pillars of International Growth. We will explore these challenges in a future post.
If you want to learn more, reach out to Phil on LinkedIn or Twitter and look out for his final post next month. In the meantime, subscribe here to get insights from other leaders in the Reforge Network, and check out Reforge’s Growth Series and Advanced Growth Strategy courses to learn how to build qualitative and quantitative growth models for your own company.
